At Wolfgang Digital we have been continuing to analyse ongoing movements in e-commerce traffic and e-commerce revenue over the course of 2020, with some very interesting results and insights.
Online Revenue
E-commerce revenue for retailers grew by a seismic 159% in 2020. To give this context, average annual growth from 2017 until now, had been 32%.
COVID has revolutionised online retail in two ways.
Firstly, while the growth in online shopping was always going to increase in time, the pandemic accelerated that growth faster than anyone would have predicted.
Secondly, COVID has brought new people into the e-commerce economy who likely would not have participated otherwise, for example, the wealthy over 65s demographic was the least likely to shop online pre-COVID. They are now hoovering up the Tesco delivery spots.
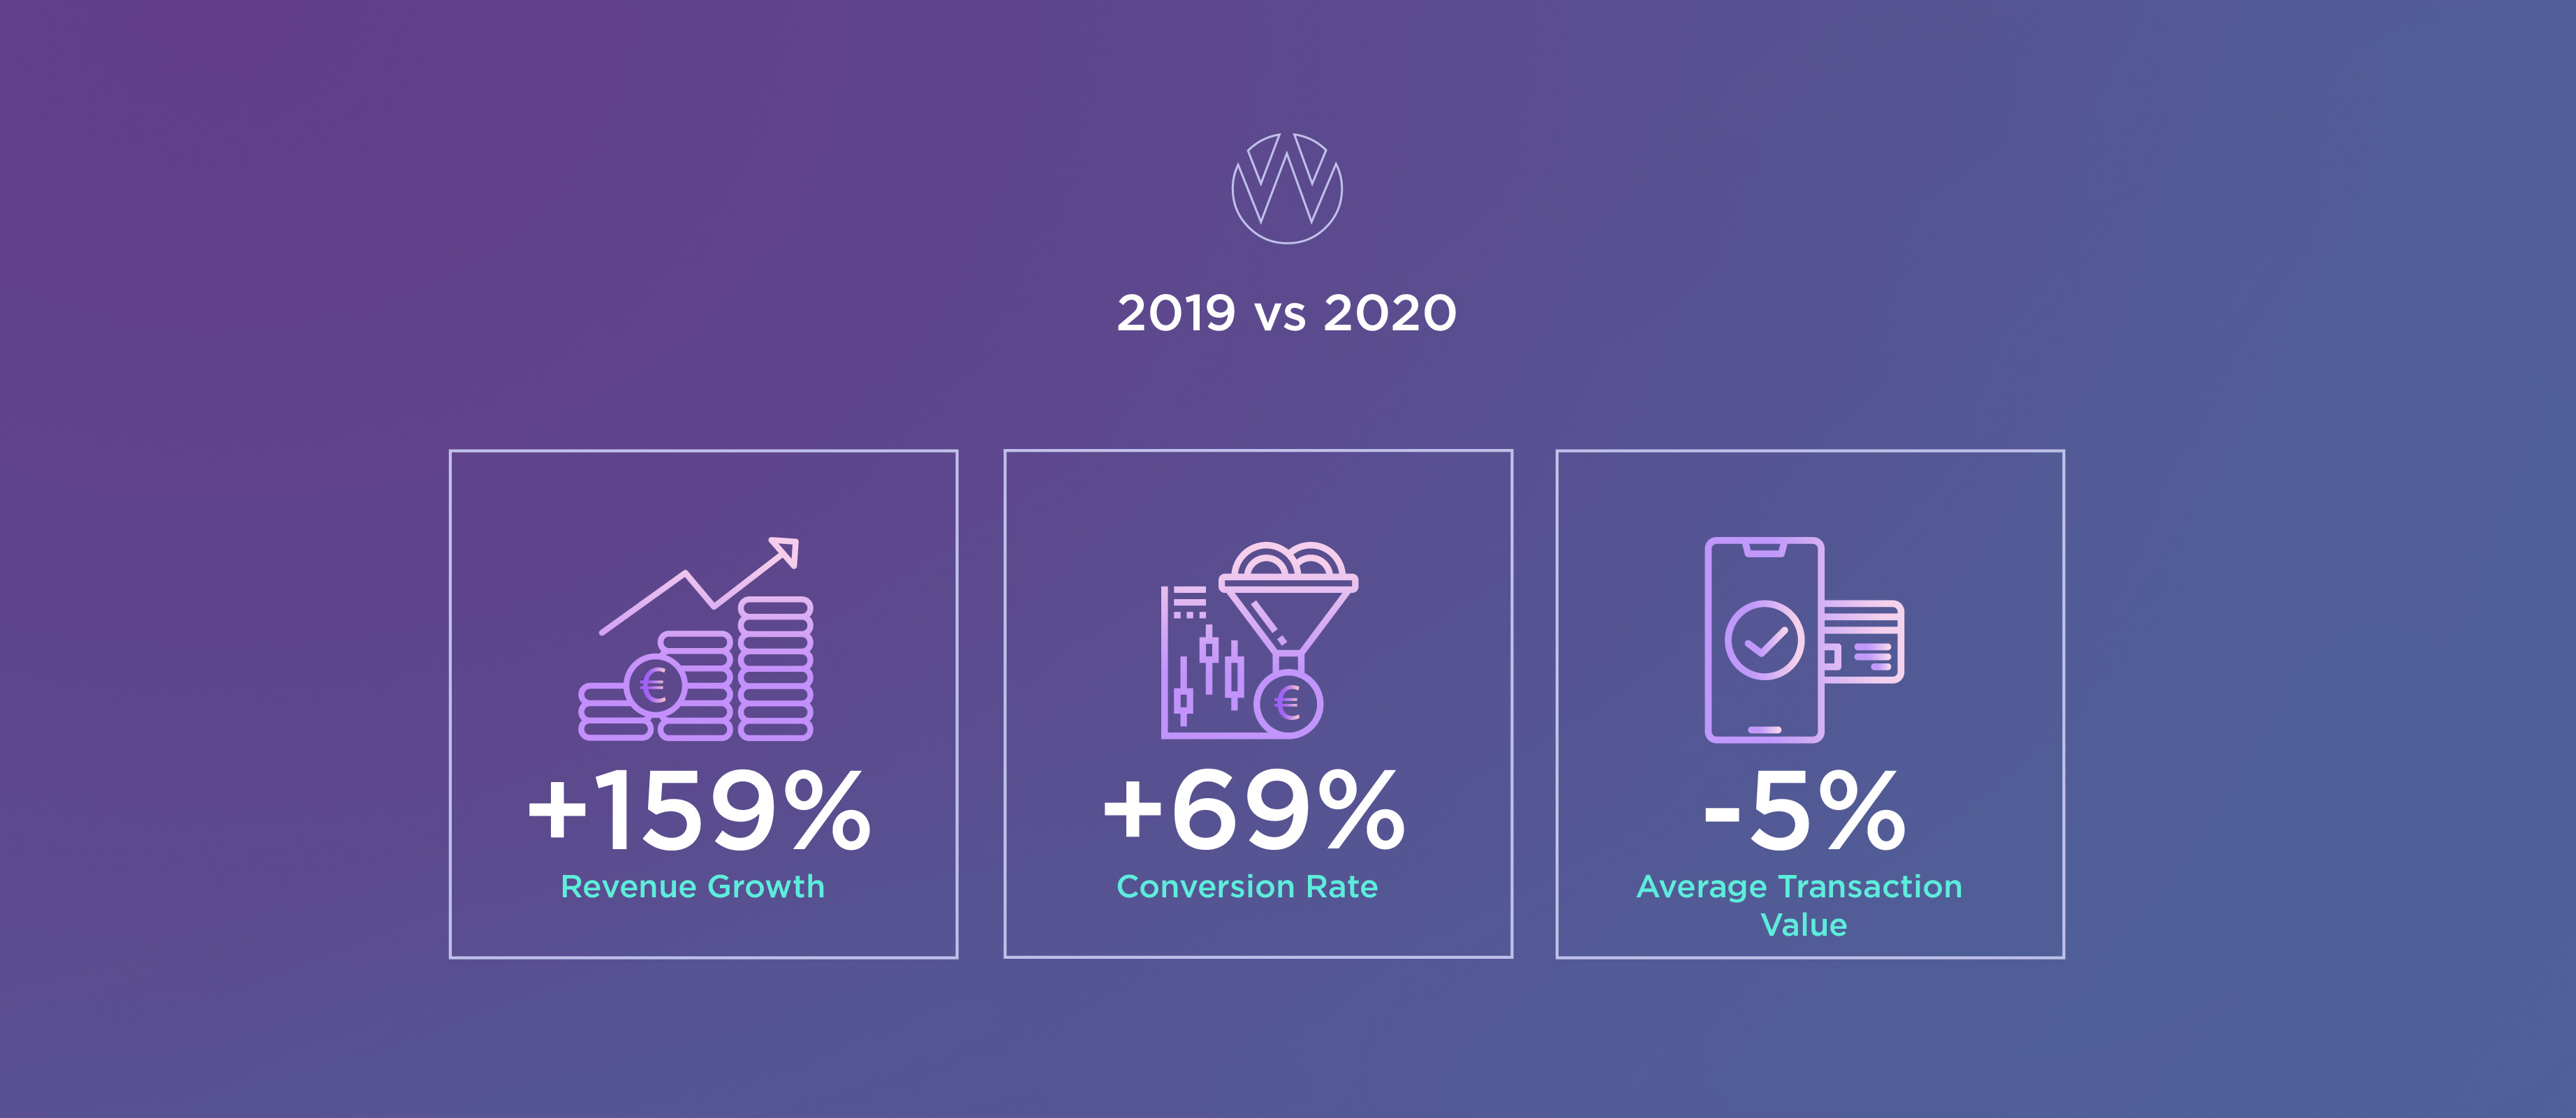
The Average Transaction Value, i.e., the average amount that a consumer spends with a business in a single transaction, actually decreased marginally while the ‘King of KPIs’, Conversion Rate, increased by more than two thirds.
What do these figures tell us?
This remarkable growth is being driven by increases in the number of online purchases and the number of online purchasers, not an increased average purchase size.
Revenue Percentile and Digital Maturity

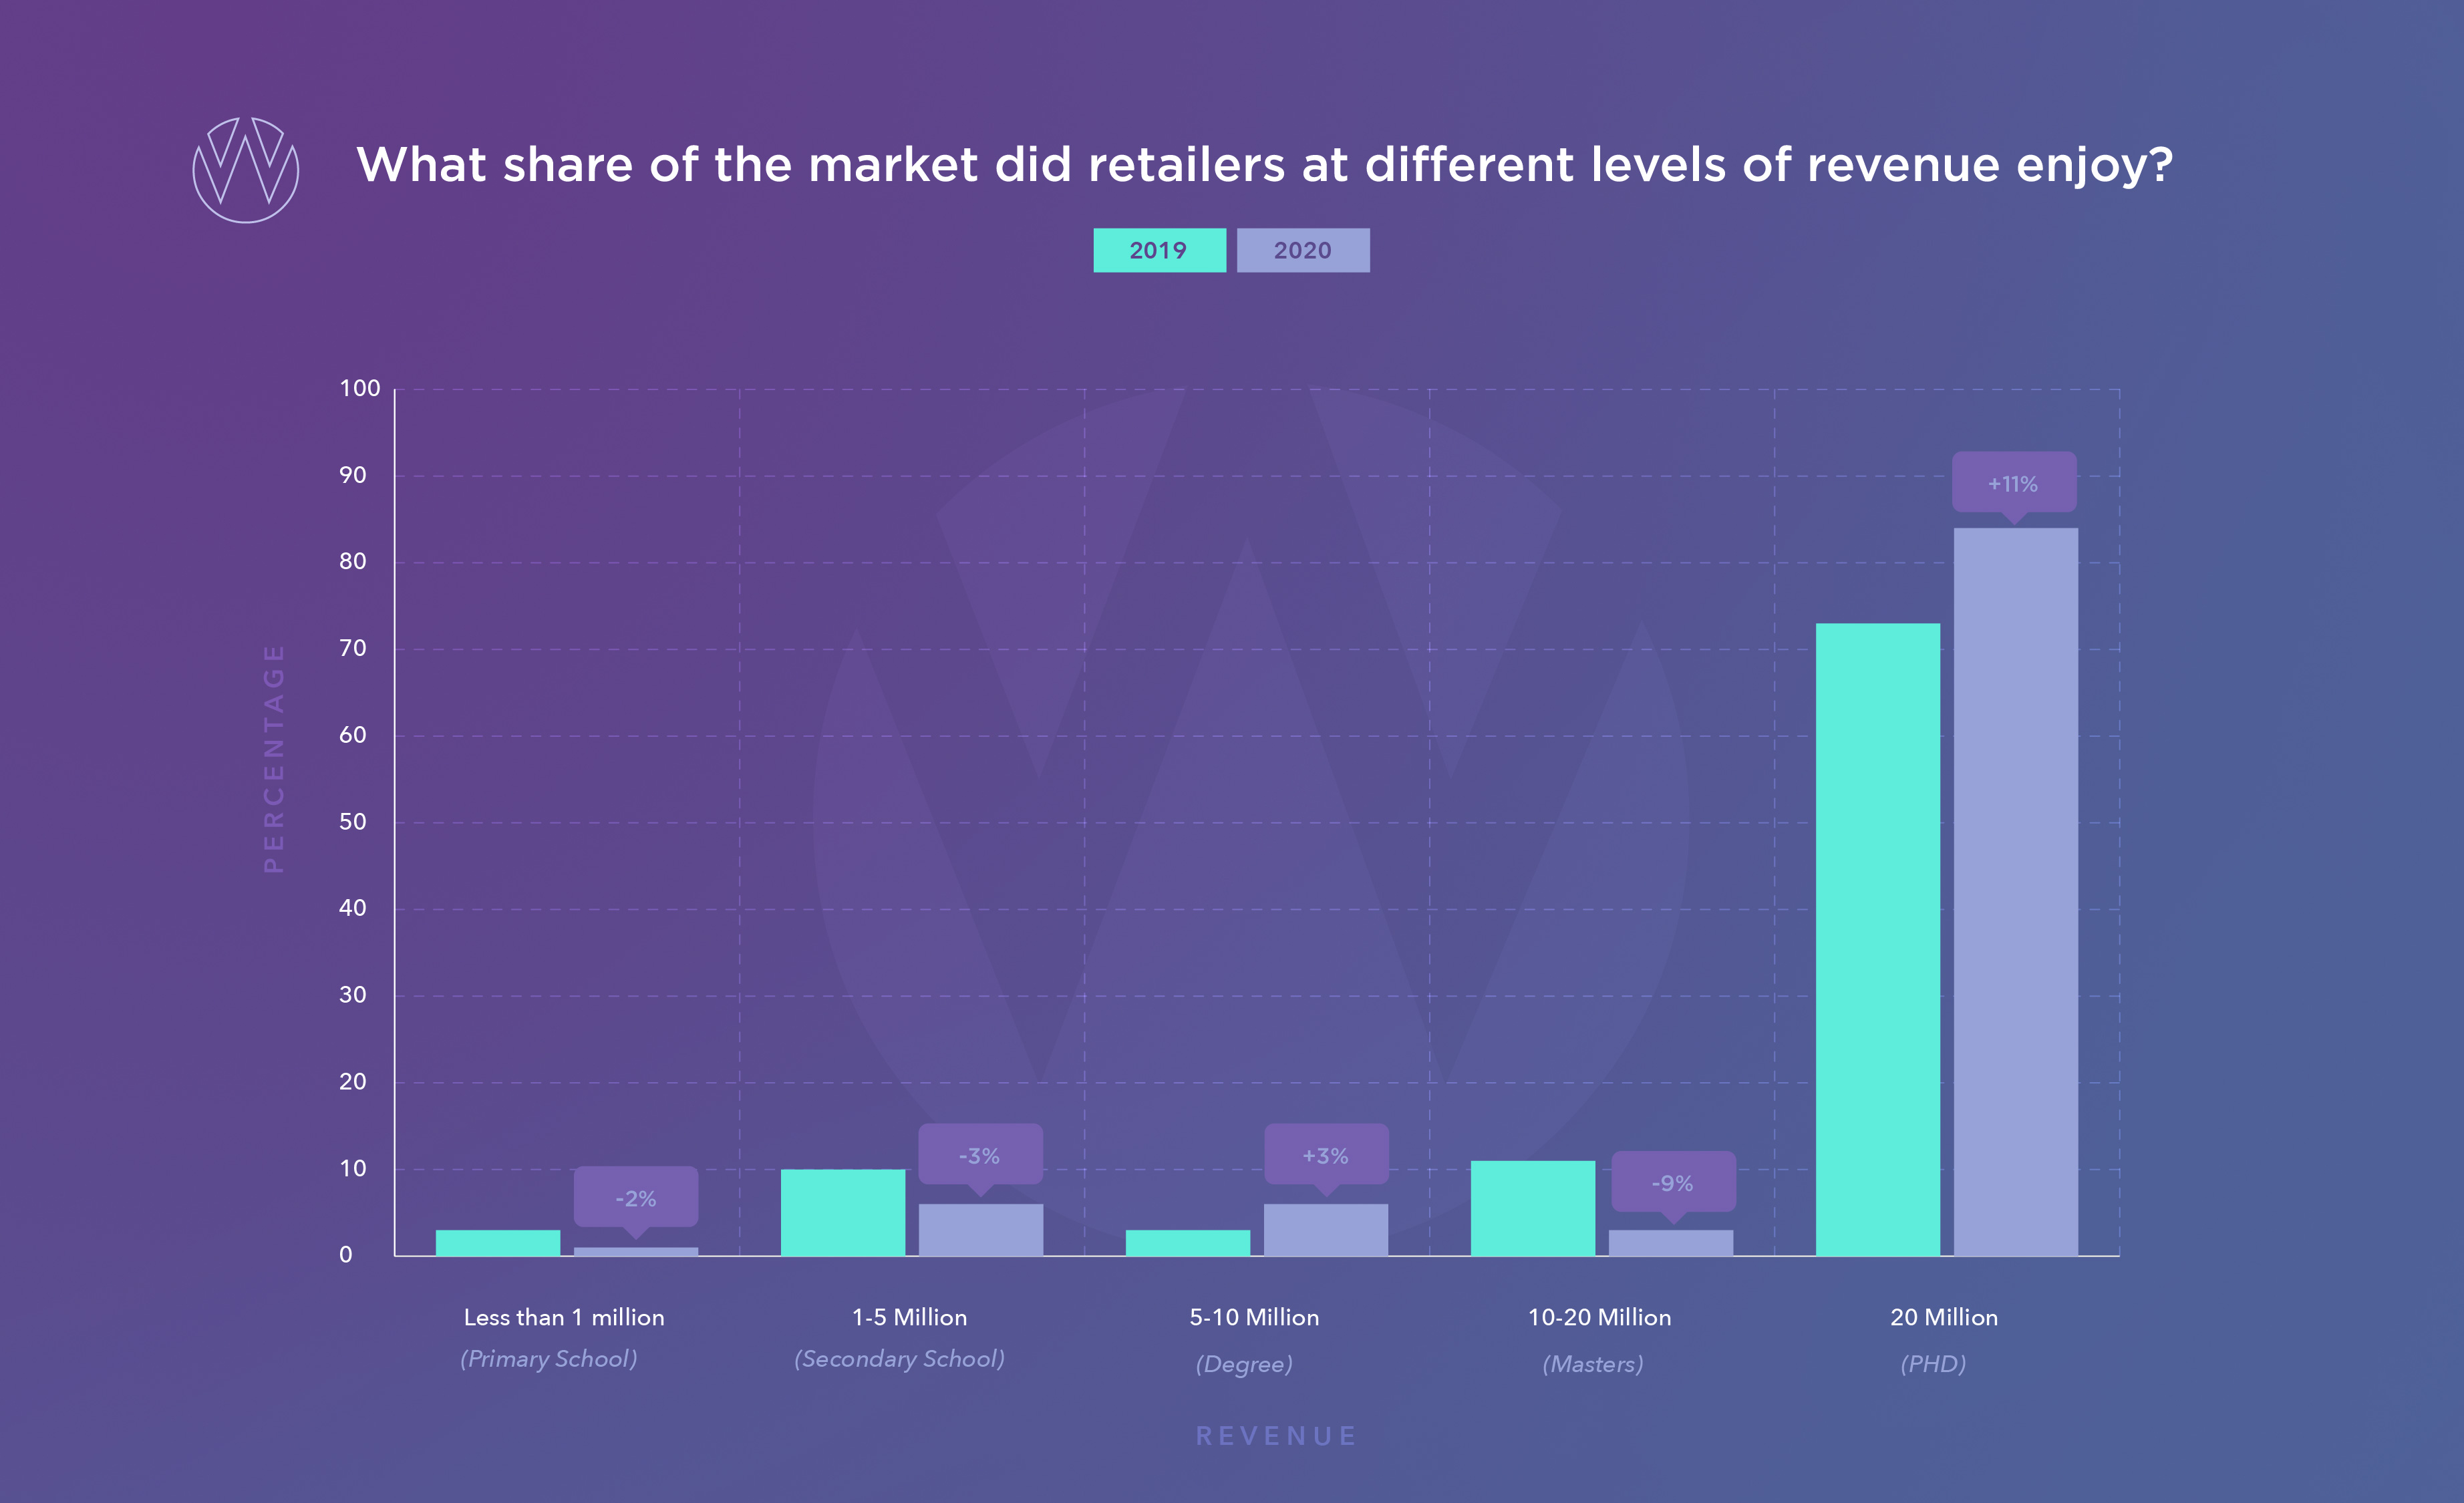
In 2019, most (59%) e-commerce merchants were making less than a million euros online. It was the minority (41%) who were sitting in the one million plus club. In 2020, this swung to the majority (67%), making more than 1 million euro online.
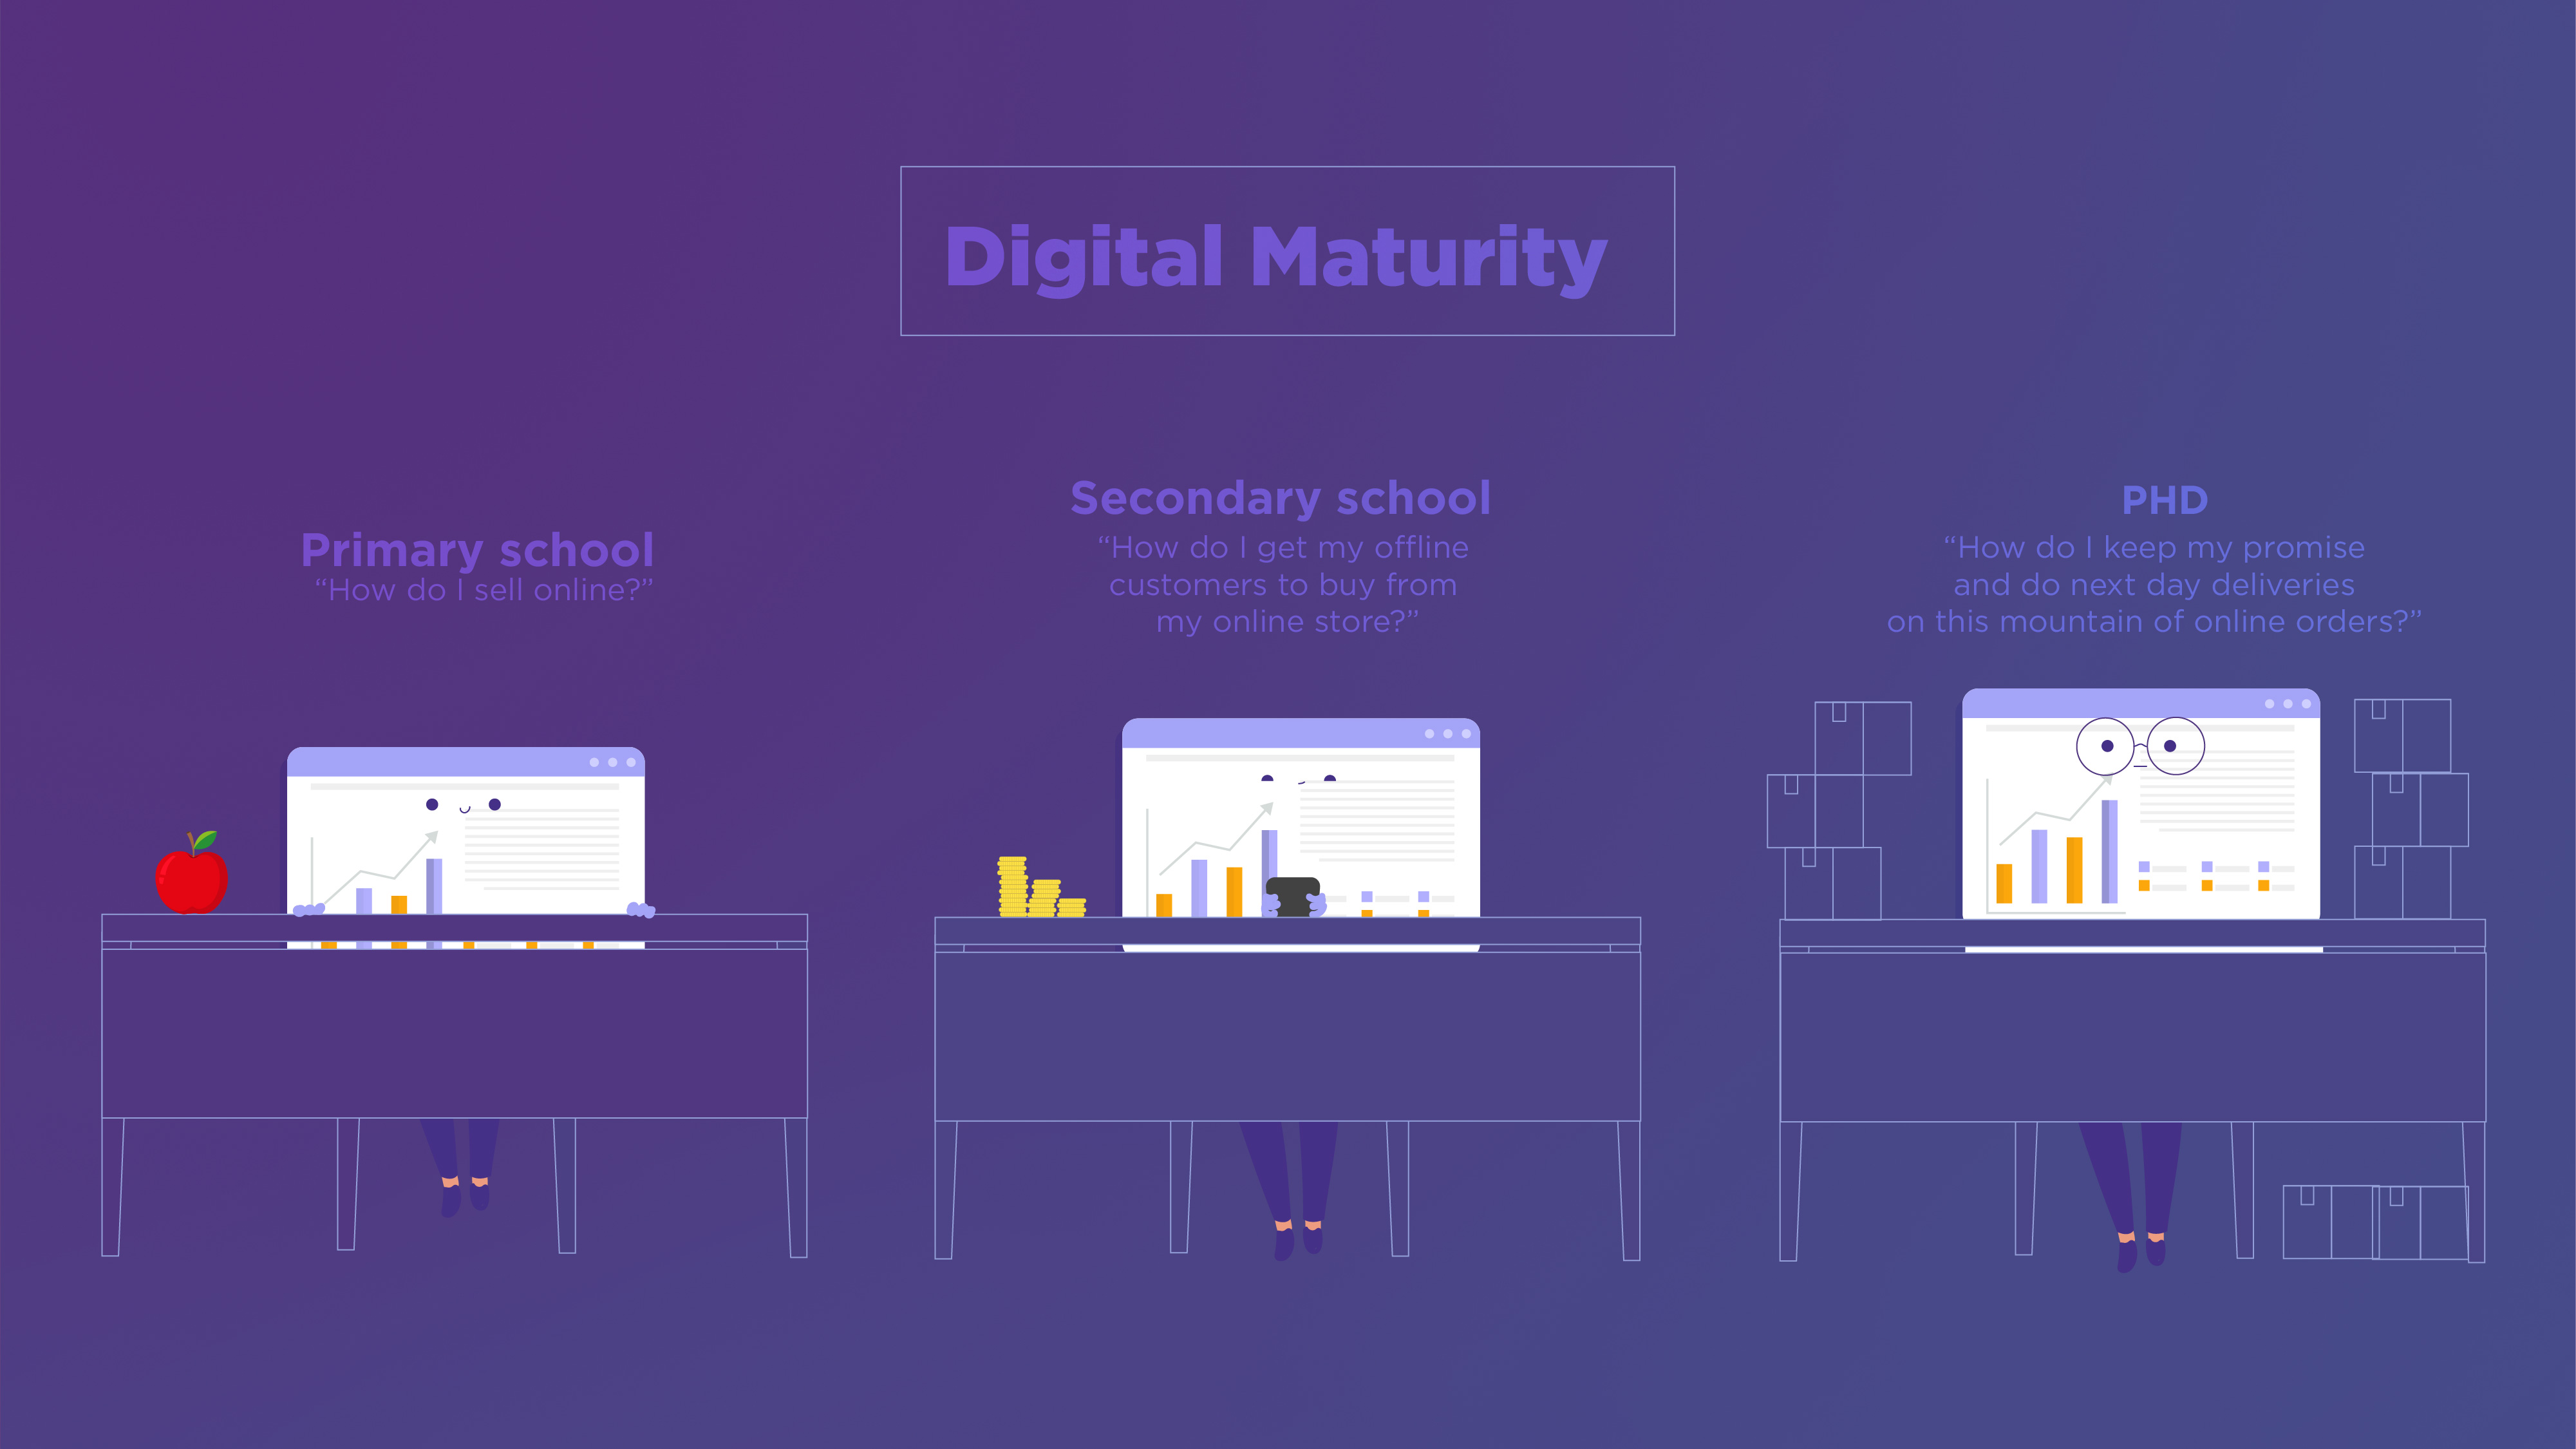
The €1 million mark is a critical benchmark for e-commerce websites. Any sellers commanding less than €1 million in online revenue are considered to be in ‘primary school’ in terms of digital maturity and any investment in salaries or service providers is likely to show a negative return on investment in the short term.
Over €1 million, the business has graduated to ‘secondary school’. Investments will start to show a positive return on investment (ROI) and the business can start to build successful investment on top of successful investment.
It’s notable that the number of e-commerce merchants sitting in the top tier, the €20 million plus cohort, our digital maturity ‘PHDs’, more than doubled in 2020. Surprisingly, the revenue growth rate for this cohort was 150%, which almost matched the study average.
Why is this surprising?
Normally you’d expect the biggest businesses to have a lower percentage increase. This huge increase demonstrates the scalability advantage of e-commerce.
An e-commerce retailer such as Lululemon can get a pair of yoga pants in every closet in the country with a great product and a digitally mature e-commerce presence. An offline only retailer would need to undertake a monumental expansion of square footage to obtain a similar result.
How do I sell online? Primary school.
How do I get my offline customers to buy from my online store? Secondary school.
How do I keep my promise and deliver all these orders tomorrow? PHD
Revenue Percentile and Market Share
Here, we look at what percentage of online spend is being captured by the different cohorts.
View graphic
The startling statistic here is the utter dominance of the biggest e-commerce websites. In 2020, the top 15% of the businesses captured a gargantuan 84% of consumer spend. COVID accelerated this trend. The largest movement in market share was to this cohort. The 35% of businesses turning over less than €1 million are now fighting it out for a meagre 1% of the e-commerce market.
This is the opposite of what was predicted by early internet evangelists. 15 years ago, the big idea was the “long tail”. Early internet thought leaders spoke of how the internet would democratise and decentralise commerce. The idea the long tail espoused is that you’d buy your rug online from a merchant in Marrakesh, and you’d buy your shoes online from a merchant in Milan.
It was predicted that when you added up the revenues of the long tail of small independent businesses, it would dwarf the revenue of the larger businesses.
While social media has democratised global media, and blockchain may decentralise global finance, the shrivelling of the long tail of e-commerce merchants in Ireland has been accelerated by COVID.
Rather than Chris Anderson’s “long tail”, we are experiencing the opposite; Vilfredo Pareto’s ‘80:20 Principle’. In Ireland in 2020, 84% of online spend was captured by the top 15% of online businesses.
Once again demonstrating e-commerce’s scalability advantage for businesses that reach digital maturity.
2020 saw businesses of all sizes experiencing package picker pounding levels of growth. And in a year of firsts, CMOs and CFOs were high fiving, or should I say elbow bumping, and celebrating ‘ROI’ at board tables the length and breadth of the country. Please make the CFO female.

Online Profitability
The language of marketing has changed as a result of performance marketing. Where traditional marketers tell stories of “brand lift” and emphasise “share of voice”, performance marketers analyse “revenue lift” and present “market share”.
This means the Chief Marketing Officer now speaks the same language as the Chief Financial Officer and the Chief Executive Officer. In Wolfgang, we’ve witnessed this shared language among clients’ board members result in budget flowing into marketing and those increased budgets leading to website revenues increasing from less than €10 million to over €20 million in a year.
We’ve witnessed multiple examples of this new view on marketing leading to exceptional revenue growth in the last year.
The digital media duopoly of Google and Facebook are the key drivers of this revenue growth. And we’ve been keenly tracking our favourite metric, Return on Ad Spend (ROAS) on both those platforms. ROAS measures the revenue returned against the ad spend.
*Google ROAS is calculated on non-brand search and shopping campaigns.
** Facebook ROAS is calculated on direct response targeted DPA campaigns.
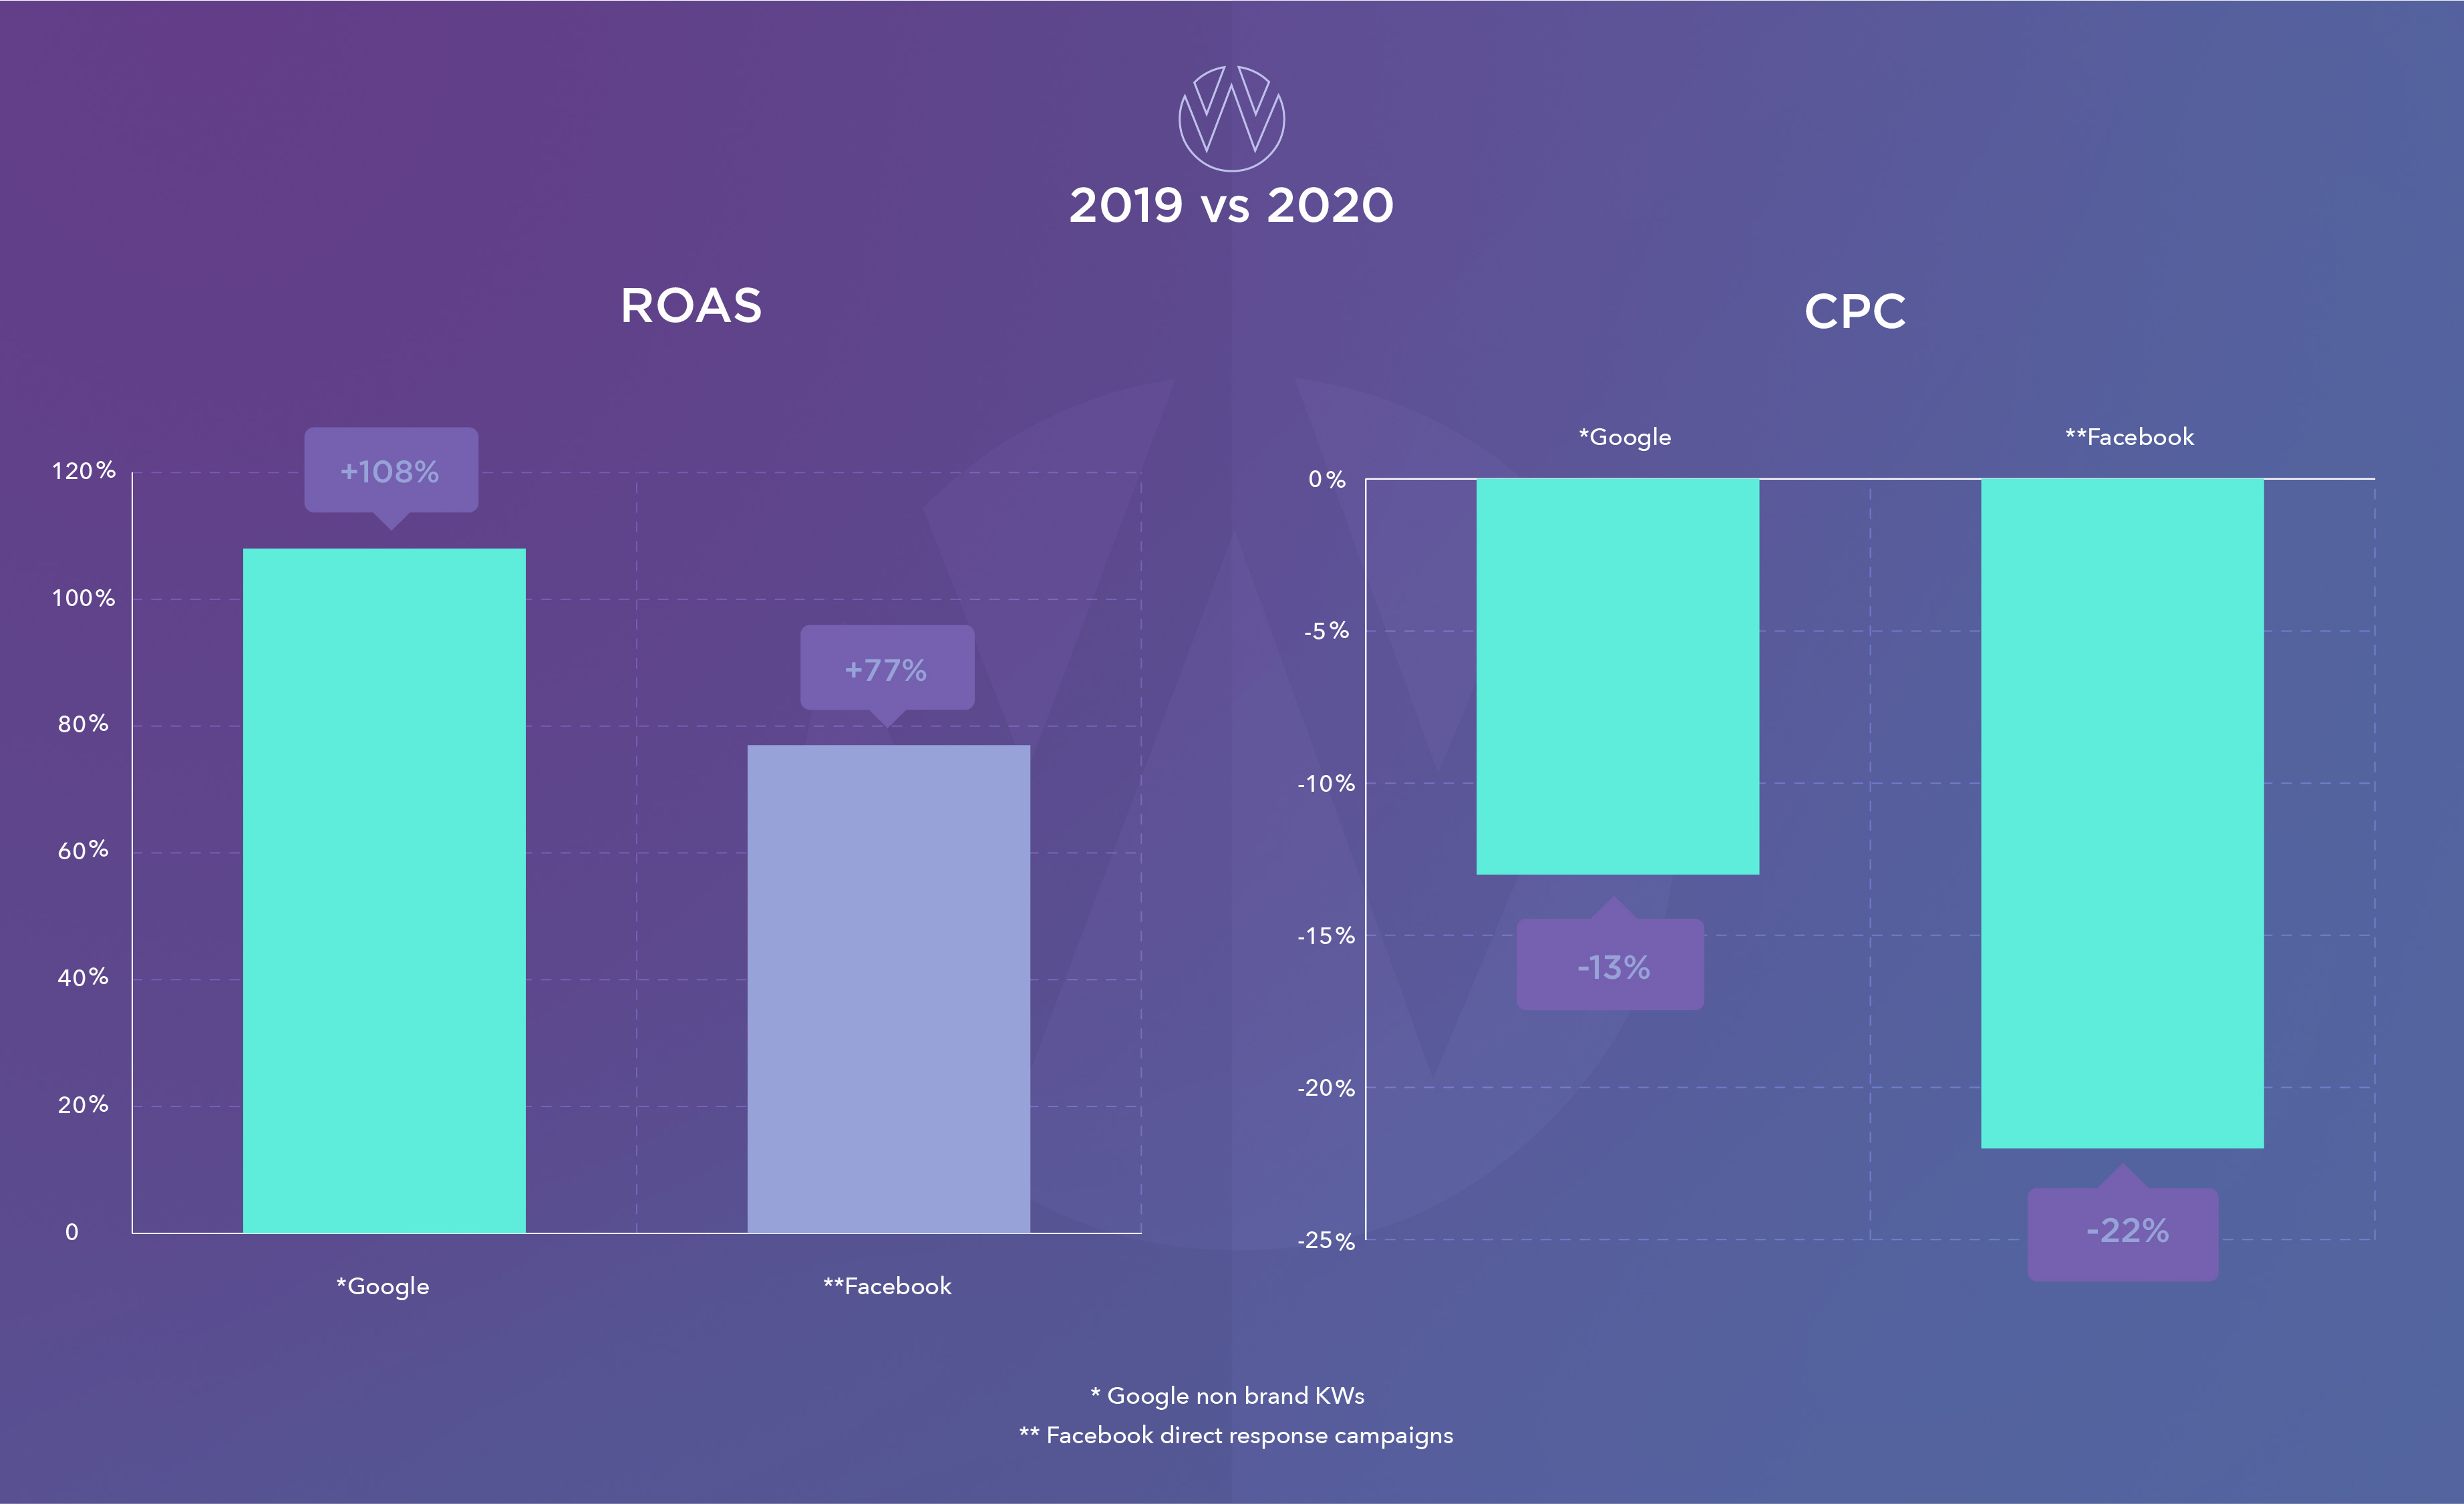
ROAS on Facebook has increased a magnificent 76% while Google has actually managed to more than double its ROAS year-on-year. Both internet giants’ ROAS have benefited from cheaper clicks (more ‘face in fone’ time = more ad impressions = lower CPCs) and higher conversion rates. But what has Google done that has allowed it to double campaign profitability in a year?
It’s Google’s AI-enabled automated advertising machine.

I’ve been a digital marketer for 14 years. In 13 of my 14 years, human-made campaigns vastly outperformed machine-made campaigns, and by some distance. 2020 was the first year in which the machines outperformed humans in the majority of campaigns.
This is an excellent example of Google’s tech catching up with its vision. Do you remember when Google declared it was a “mobile first” company? And do you also remember that every year for the next six years was declared “the year of mobile” until finally the amount of mobile traffic overtook desktop traffic in 2017. That very year, Google shifted its focus from “mobile first” to become an “AI first” company. Three years later they have delivered on that vision with their AI-enabled automated campaigns, which have undoubtedly contributed to the ROAS doubling year on year... And in half the time it took them to realise the “mobile first” vision last time around!
In crunching the numbers, we’ve found the blended ROAS for Google and Facebook is 8:1 (sign up for our newsletter to get a deeper dive into the data which includes average ROAS on each of the platforms).
This 8:1 ROAS insight is instructive to businesses seeking to grow their online revenue. If a €12 million website wants to hit €20 million, this insight allows the CMO to forecast to the CFO that an extra €1 million in ad spend with Google and Facebook should see them increase their online revenue by the €8 million required to hit the €20 million mark.
All they need is the skills to spend the money wisely.
Window of Opportunity
Every e-commerce website’s biggest competitor, and Google’s biggest customer, Amazon, has savagely cut their Google Ads budget in Ireland.
We’ve analysed Google auction insight reports and independent tools to discover that Amazon has reduced its January 2021 spend on Google Ads by 50% year-on-year.
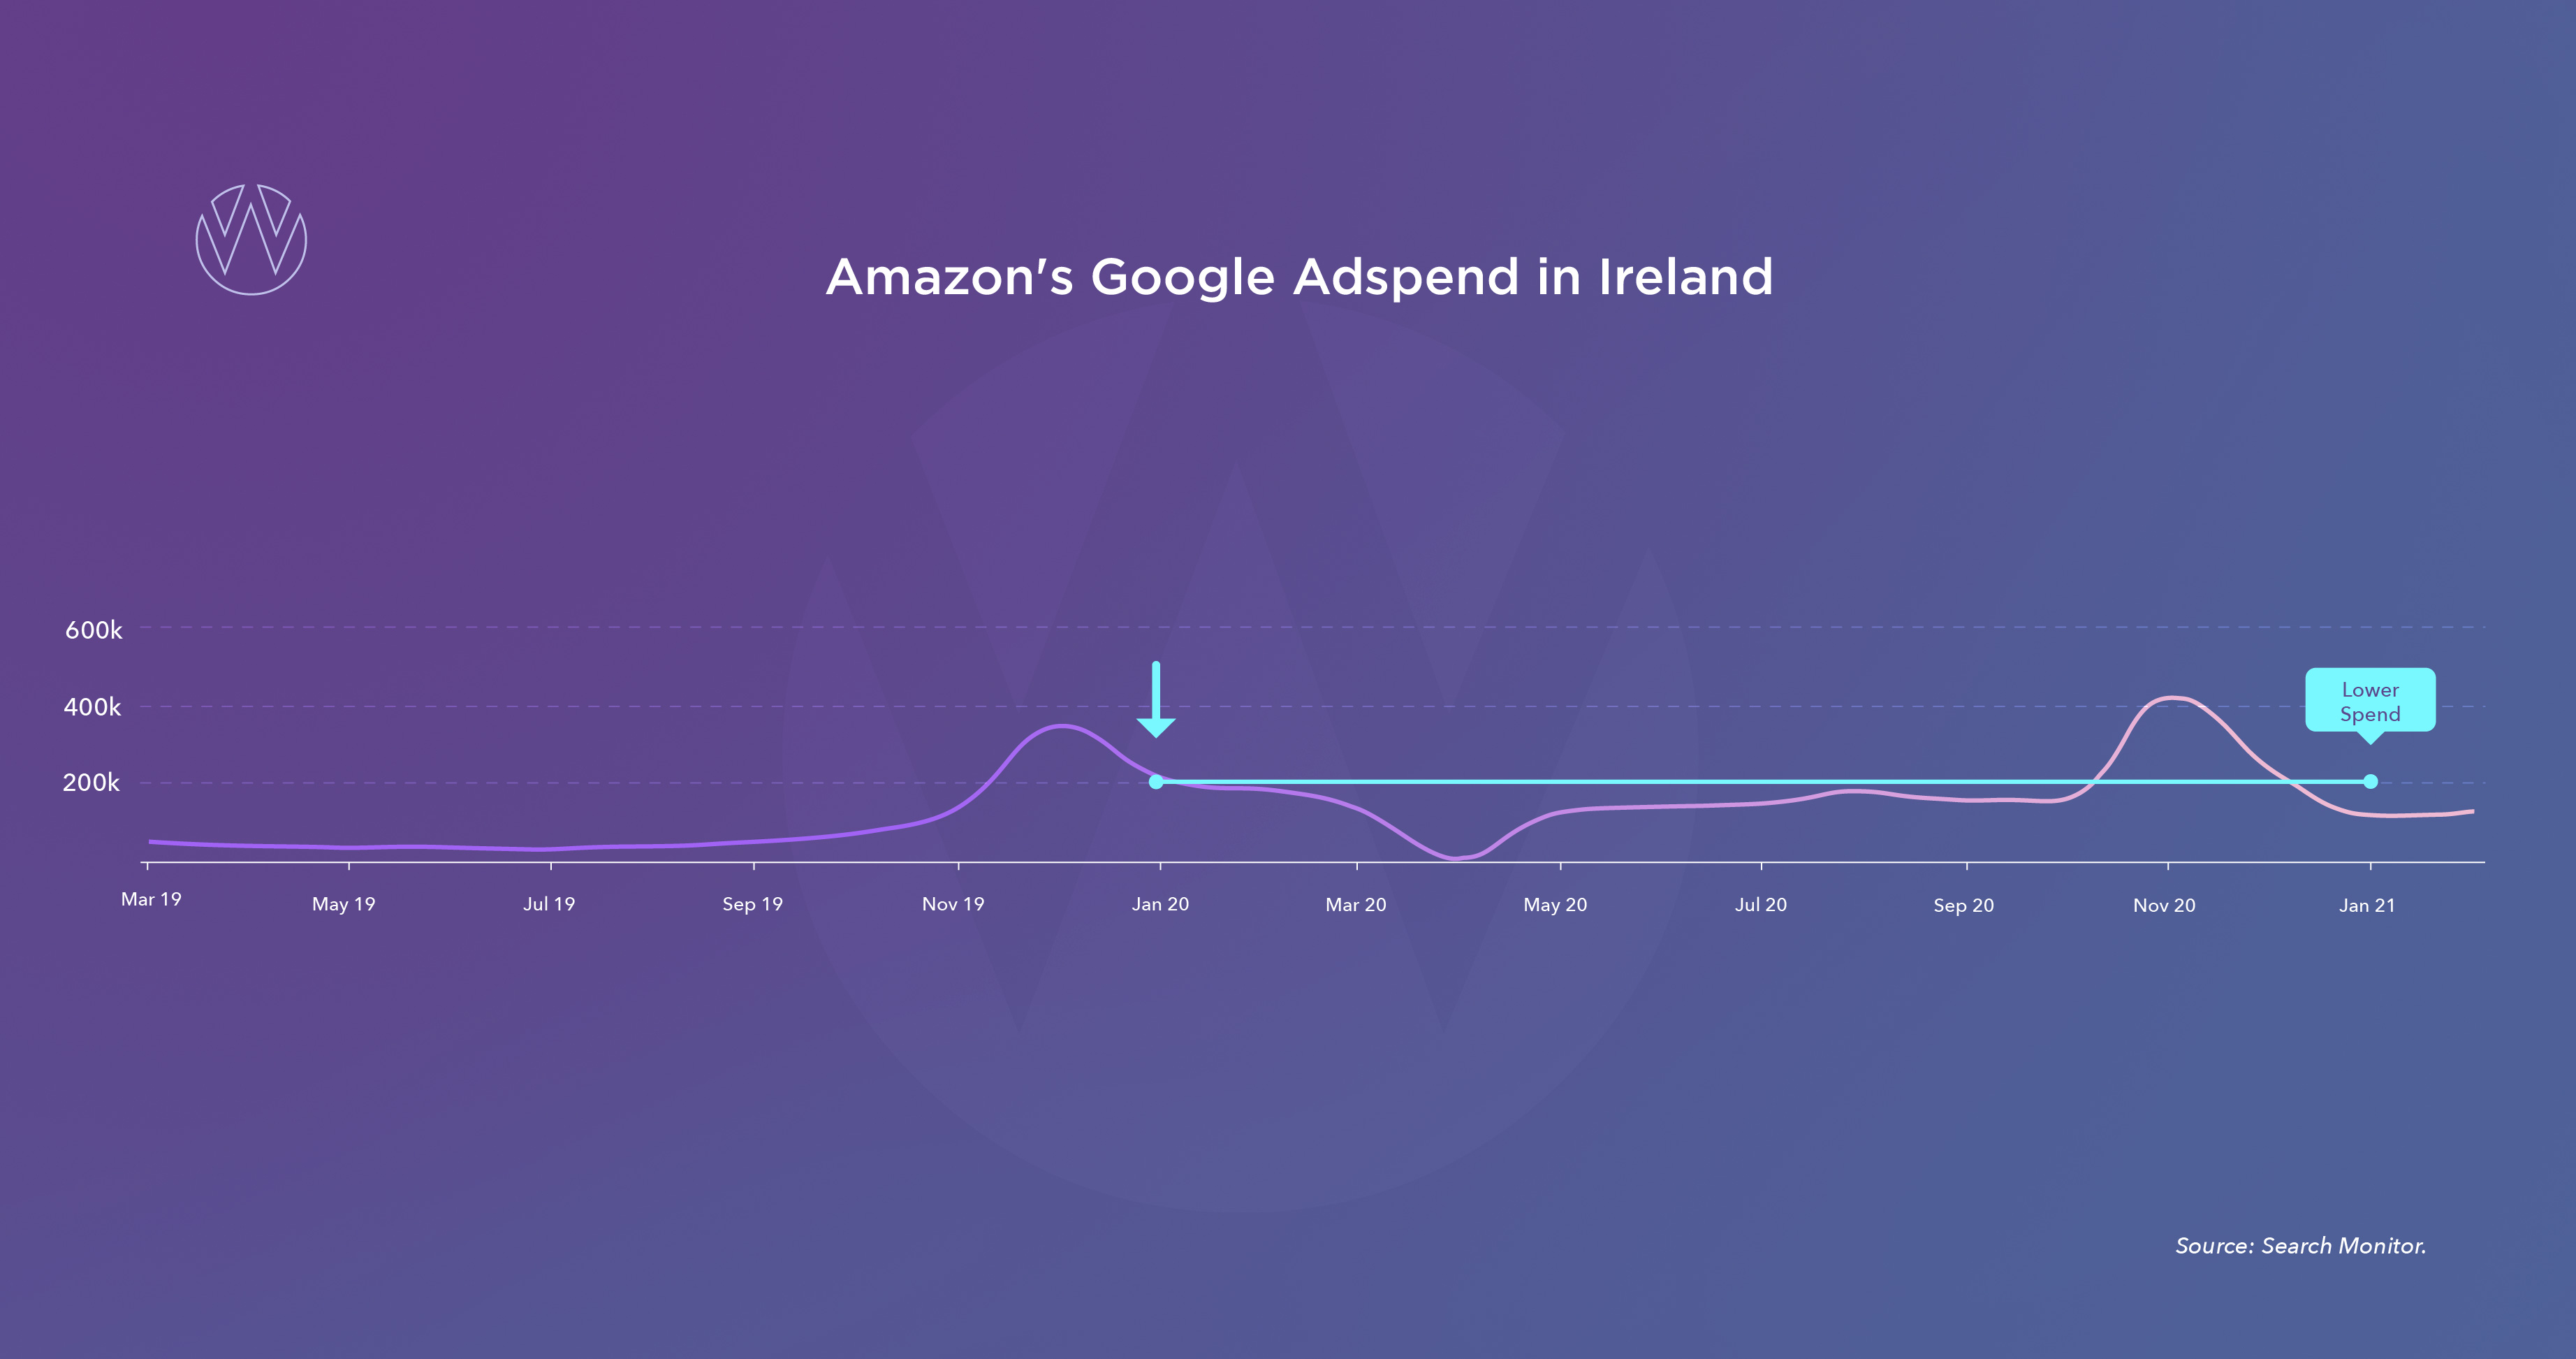
As a result of Brexit associated costs and delivery issues, Amazon is in the process of opening a fulfilment centre in Ireland and it is expected that Irish customers will be able to buy from amazon.ie rather than amazon.co.uk. It appears Amazon is reducing its advertising to the Irish market until these initiatives are complete.
This presents a window of online opportunity for Irish retailers to capture customers that otherwise would have been buying from Jeff Bezos’ internet behemoth.
This reduction in competitor spend comes at a time when Ireland is facing more than a month of extended lockdowns forcing consumers online. The online opportunity is heightened in the short term.
What Next?
Amazon will ramp their ad spend back up.
COVID lockdowns will pass.
But, in the meantime, smart e-commerce merchants will have captured new customers and fast-tracked their digital maturity.
One of the beautiful advantages of selling online is once you’ve made a sale you own the customer’s email address. A customer relations management (CRM) strategy can leverage this asset to convert a once-off shopper into a valued customer for life.
Given the headwinds of scrutiny on privacy and the end of the third-party data party, combined with business’s engorged databases of new customer contact details, we at Wolfgang expect CFOs and CMOs to be calculating ‘customer lifetime value’ and getting excited about “the year of email” in 2021.
Key Takeaways
- 2020 saw revenue grow by a package picker pounding 159% year-on-year. This compares to an average of 32% over the previous 3 years.
- Two thirds of e-commerce websites now turnover more than €1 million.
- 2020 e-commerce market share converged to the Pareto principle of economics. The top 15% of e-commerce websites by revenue (>€20 million) captured 84% of consumer spend. This is the opposite of the “long tail” that wags the dog prediction of early e-commerce evangelists.
- Google advertising ROAS doubled while Facebook’s was up by two thirds. In 2017, Google declared itself an AI-first company and said its Smart campaigns would turbo charge advertisers’ growth. 2020 was the year Google’s tech caught up with its promise and ROAS, driven by Google’s Smart campaigns, doubled.
About the Data
There is half a billion euro of online spend in the dataset in 2020. This represents approximately 7% of the Irish e-commerce market (source: JP Morgan) so it’s a very significant sample size.
The smallest contributing business was turning over €20,000 per month. The largest contributing business was turning over €20 million per month. All the figures we show are averages across the clients. So, the smallest contributor’s revenue increase is weighted equally to the largest contributor’s revenue increase.
NB. If you are a regular reader of our reports, you will know that in previous years, we’ve reported on both travel and retail. Travel has tumbleweeded and was down 58% year-on-year. Unfortunately, there’s not much to say beyond that. So, for this year’s report we focus on e-commerce retail.